182
See image attatched.
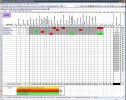
Basically the table at the bottom uses a countif for the information in the table above, which is then used to create a graph.
I've been asked if its possible for the bottom table's values to change as you filter the results. So if you select only one contract from the top left, the table at the bottom changes to reflect only what is shown by the filter, as at the moment it still counts all cells.
Anyone any ideas?
Thanks