Long overdue an update... a few weeks ago I got a set of reconditioned injectors, to make sure they were all well balanced and 'as new'. I wasnt sure if the Cylinder1 issue on the other engine was down to a bad injector or something else, but better to be safe..
As previously mentioned a bit further back I also fitted an AEM Wideband, into the extra boss I put on the exhaust, and the gauge is now mounted in a visible place..
Apart from that, the rest of the car/engine has been going well. Its about ready for an oil change now.
Had a bit of an intermittent issue with the alternator which stopped charging if you went over 4000rpm, but that was soon sorted by swapping out the regulator with my spare. I also had a small leak from the back of the rocker cover, I think I may have cracked the cover when putting the engine in (hit on the bulkhead). I swapped the rocker cover with the spare one of the old engine along with a new gasket and no more leaks..
--
So over the past few weeks I've been doing a lot of work on a way of logging data using what I already have - no aftermarket ECUs, no production data loggers or additional sensors etc. I wanted it to work with what was already on the car, and the stock ECU.
The main reason for wanting to log data was so I could review RPM vs AFR, and other things such as Throttle Position etc, once I was back on a computer, as its neigh on impossible to watch everything all the time when driving. A quick glance at WOT is fine, but apart from that you've got no chance.
Il go into quite a bit of detail here, just for reference if anyone ever finds it - Its all quite technical, so just look at the pictures if you want! Most of this information is not readily available out there on the internet - I've spent weeks reading and testing, but most has been trial and error as there is literally no solid information given by anyone. There is one other piece of software out there that can simply log/graph BMW ECU data, but its closed source (so you can't see how its been done), and has to run on Windows (sigh!) - I didn't want an actual laptop running in the car all the time!
So firstly, I had to figure out how I was going to get data from the engines sensors. These days many people know about the BMW INPA software, which is used for fault code reading/sensor value reading on the older BMW models. You can use this on a Windows laptop with a VAGCOM KKL cable and a BMW 20pin (diagnostic) adaptor, which works fine.
Inside INPA, you can view live sensor data and do various sensor/actuator tests, which is handy. The problem is, the refresh rate on this data is terribly slow, 1 update per second, if that! The E36 is not technically OBD, it will report simple fault codes in generic OBD language to off the shelf code readers, but if you want to read sensor data BMW use their own type of data protocol. This is known as the DS2 Protocol.
The reason INPA is slow at refreshing data is simply due to the software layer between the INPA application and the serial data going down the cable. It is possible to bypass this software layer and talk to the ECU directly over the serial port, thats if you know what commands to send, and in what order.
Essentially when you are using a VAGCOM cable, the driver on your computer installs it as a COM port. With this in mind, the INPA data goes backwards and forwards over this COM port. Next step was to use a COM port monitor to view the raw binary data going over this port, and it may give a clue to how the software is talking to the ECU. I started INPA and got the Analog Sensor Values screen up, which shows information for most of the sensors you would want to see, then started monitoring:
What you can see here is the binary data being sent by the computer, and what what the ECU is responding with. The application shows the data in Hex format. This is the basis of the DS2 protocol (you can read more on the basics of the DS2 protocol
here, but it does not go into much detail about specific models or ECUs). The protocol consists of a constructed data packet:
Code:
[Address] [Length] [Data1] [Data2] ... [Data n] [Checkum]
[Address] is the address of the computer being queried.  Examples are 00 (Central Body Computer), 12 (ECU), etc.
[Length] is the total number of bytes in the message.
[Data] is one or more bytes which comprise either the command (from you) or the response (from the computer).
[Checksum] is an XOR checksum for the data being sent/received.
So when looking at the screenshot of the serial port monitoring above, this matched. INPA was sending:
Code:
12 05 0b 03 1f
[ECU] [Message Length (5 Bytes)] [Message 1] [Message 2] [Checksum]
...and getting a big long reply back - This is the data for all the sensor values. The ECU will always respond with the command you have sent first, then the rest of the information. The first three bytes of this reply are always a bit of static information:
Code:
12 1d a0
[ECU] [Message Length] [Status]
The status field can be one of three values. a0 = Acknowledged, a1 = ECU Busy, FF = Bad Command. Basically this means you only want to ‘record’ data that comes back with an a0 response, as that states that the reply is good.
The rest of the ‘bytes’ after this were a complete unknown at the time - they are a list of all ECU sensor data, but there is no documented resource or information out there telling you what is what for an MS41 E36 ECU. This is not to mention that HEX data is integer (whole) numbers, and the information you see in INPA is precision sensor data sometimes to 4 decimal points. So there had to be some sort of conversion or calculation to get the actual sensor readout.
Before I looked into working out which byte was which sensor, I wanted to try and manually talk to the ECU using a COM port terminal, to see if I got a response without any other software running. I used a virtual machine (running Linux), connected using the same cable, at 9600baud, and sent the same command as above. I then read the contents of the serial buffer to find the ECU responded with the full string of data. This essentially meant I could communicate with the ECU directly over the COM port, without the need for any of the INPA software.
Because you are missing out the software layer that INPA uses with the above, you can send this command to the ECU over the COM port and read the responses much quicker. I quickly wrote a small script and managed to get the request sent/data string back from the ECU 6-7 times per second (6-7 times quicker than INPA can) before I getting 'ECU Busy' responses. Not a bad rate of data at all.
With that in mind, next was to decide what hardware and software to use for building something. It had to be small form factor, quick, efficient and accept different types of inputs, especially USB. There was only one choice really, a Raspberry Pi. I've had a Model B Rev2 lying about for a while, so this was a good excuse to put it to use. They offer good performance, decent RAM and very small form factor.
I installed a lightweight version of Raspbian Wheezy on a 4gb SD card. I decided to use Python for the logging application, due to speed and rapid application development. Although I have not really used it much, I'm only really proficient in C, PHP, ASP when working with databases.... but general logic and syntax does not really change so I stuck with it. After checking the USB serial cable worked fine with the rPi and Python the development started..
I only had two things in mind for the software to begin with - logging the data as quickly as possible and writing it to a CSV file for use in data log explorer/viewers. Databases are not really quick enough on a rPi to be writing data 5+ times a second without filling up a buffer and using more CPU time, so I stuck with flat files. Luckily there are plenty of libraries in Python for doing these sort of things.
As mentioned above, I knew the data being read from the ECU was all sensor values, as this is what INPA was using to display the values on screen. After a week of reading and searching, I found out that INPA uses another piece of software in the background, called ToolSet32. This program has a folder under it, with a file for each ECU model (mine being MS41), containing information about each sensor value and ECU parameters.. I thought great! Although, when you try and open it, everything was in some sort of encrypted format.
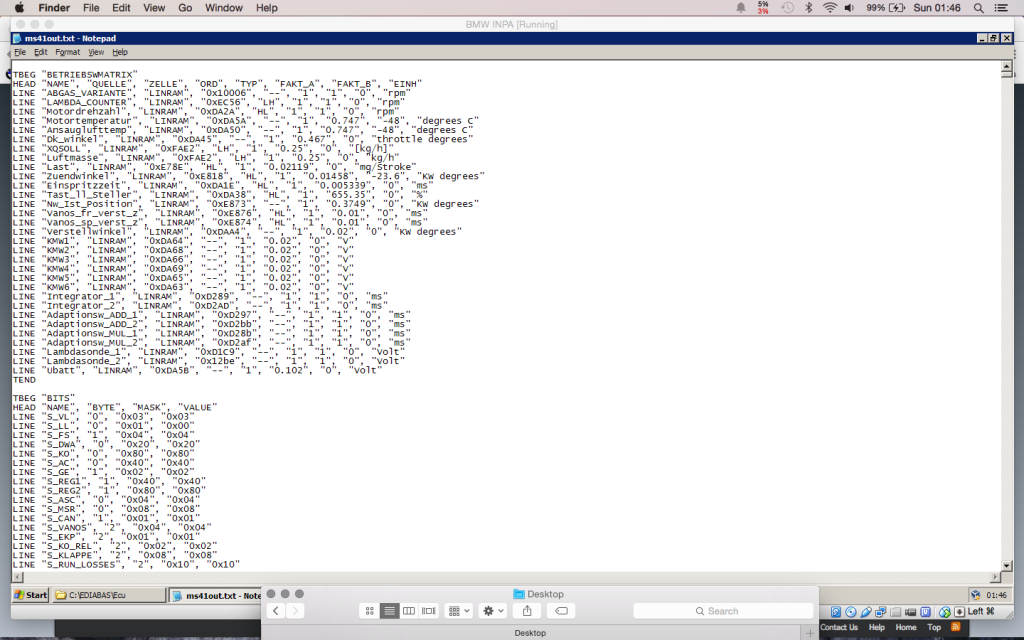
More searching found a Polish developer that had created a small utility to try and reverse engineer parts of the file to get some readable data from them, which sort of worked (he had made it for the E39, not E36). Everything was in German as expected, some parts abbreviated and it was no real help bar one thing - there was a section that gave multiplication factors for each sensor, two columns of them (FAKT_A and FAKT_B). This is how you would get from a whole number to a correct decimal value for a sensor. Although, the problem was there was nothing in this file which described which 'byte' of the ECUs message was for which specific sensor, so there was a lot of trial and error to come...

Development started on a virtual machine with a laptop so get the basics of the program working over the serial port. I wanted to find at least one 'byte' that made sense, so started with an easy one, Battery Voltage. From the above table, UBATT has a multiplication factor of 0.102. I went through each ‘byte’ of the ECUs response, converting the HEX value to Decimal, then multiplying it by that factor until I got something like a battery voltage.
Eventually I found that 'byte' number 20 in the ECU's response was the correct piece of data. The HEX was
8b, which in decimal is
139. Then, use the multiplication factor,
139 * 0.102 = 14.178 V. With this now worked out, I started to create an application to read this byte in a loop, do the calculation and output it - I kept the whole thing down to approximately 5 messages/responses per second, which seemed a good starting point..
Before working out any of the other ECU sensor values, I wanted to look at the wideband. I already knew that the AEM wideband gauge outputs serial data constantly on one of its connector pins, containing the current AFR value (this is used for production off the shelf data loggers). I wanted to interface this output with the same script, so it is read at the same time as the ECU data, and everything is synchronised. I used a spare USB > COM port adaptor, and hooked the wideband gauge up to it. I modified the first script and got it to 'listen' on the second COM port, interpret the data and output it at the same time.
The first column is a timestamp, the second column is the Volts, and the third column is the wideband AFR data. This was basically the basics of the application, constantly speaking to the ECU, parsing its response and doing something with the data - in the above case, printing it to the screen.
The next big job was to work out which other 'bytes' of the response were sensor values, I had the Volts, so using the same trial and error process, I had some time consuming research to do. One thing I did notice was INPA sent different commands to the ECU for some specific different readings. The majority of the values are all in the one big long string as above, but a handful of others are completely separate commands. The ones I found which had a different commands were Throttle Position (in Volts, which is the actual TPS reading), Lambda Voltages and Air Mass. The reason these have their own command is the data is stored in a different RAM address inside the ECU, whereas all the rest are stored sequentially.
After quite a lot of time, I had calculated which 'byte' represents each sensor, and I could read all the correct values through the application - which was great. In the end, some of the values span over two 'bytes', and require more calculation, which was confusing. Unfortunately I'm not going to just give this information away, unless someone is genuinely interested and is making an effort on their own. Its not out there on the internet - and its possible for anyone to work out with enough research/effort, considering I've documented most of the process here. Anyway, the list of values that I can now log is:
Code:
RPM - x 1000
AFR - AEM Wideband
Air Intake Temperature - Degrees C
Coolant Temperature - Degrees C
Ignition Advance - Degrees
Injector Duration - ms
Camshaft Angle - Degrees
Engine Load - mg/Stroke
Air Mass - kg/h
Idle Control Valve - Current Position %
Battery Voltage - Volts
TPS Voltage - Volts
TPS Percent - Calculated Value Based on TPS Voltage, between 0-100%
Speed - KPH
Lambda Bank 1 - Volts
Lambda Bank 2 - Volts
Lambda Heater Bank 1 - %
Lambda Heater Bank 2 - %
There are more values available with different commands, like various adaption values for fuel, lambda etc. For now I some of the values are not being logged, as I don't need them. For example with having wideband logging, I don't really need to log the standard Lambda sensors, unless I think there is ever a fault.
Now I had everything documented, I set up Python on the RaspberryPi. I got the two USB > Serial cables setup, and checked I could talk to the ECU. Everything was fine, so I loaded the 'test' application I had made on the virtual machine and ran it - connected the laptop to the rPi so I could see what was happening, and sensor data started coming through, which was great and proved it actually works. The rPi runs on 3.3-5v, so easily powered using a USB cable from a 12v adaptor.
I modified the application further, using Pythons great threading module, so you can have multiple things running in sync. I needed this so the wideband data was always up to date and not an 'old' reading from the gauge. I then added in the CSV library, and got the program to output to a file instead of printing it to the screen. Here is an example of the output (engine was off), in CSV format:
Code:
Time;Date Time;RPM;AFR;Intake Temperature;Coolant Temperature;Ignition Advance;Injector Duration;Camshaft Angle;Engine Load;Idle Control Valve;Battery Voltage;TPS Voltage;TPS Percent
113.593333;01/01/70 01:01:53;0;15.7;18095.000000000004;32.39999999999999;5.866999999999997;0.0;0.0;0.0;12.038039999999999;11.729999999999999;0.663;0
113.822107;01/01/70 01:01:53;0;15.7;18095.000000000004;32.39999999999999;5.866999999999997;0.0;0.0;0.0;12.038039999999999;11.729999999999999;0.663;0
114.050493;01/01/70 01:01:54;0;15.7;18095.000000000004;31.950000000000003;5.866999999999997;0.0;0.0;0.0;12.14514;11.729999999999999;0.663;0
114.278498;01/01/70 01:01:54;0;15.7;18095.000000000004;31.950000000000003;5.866999999999997;0.0;0.0;0.0;12.14514;11.729999999999999;0.663;0
The reason the date shows as 1970 is the rPi has no real-time clock or battery, so it has no way of keeping the current correct time. It does not matter to me, as I'm only really using the first column, which is in seconds. The other floating point values (with a lot of decimal places) needed trimming down to 4 decimal places to keep things clean.
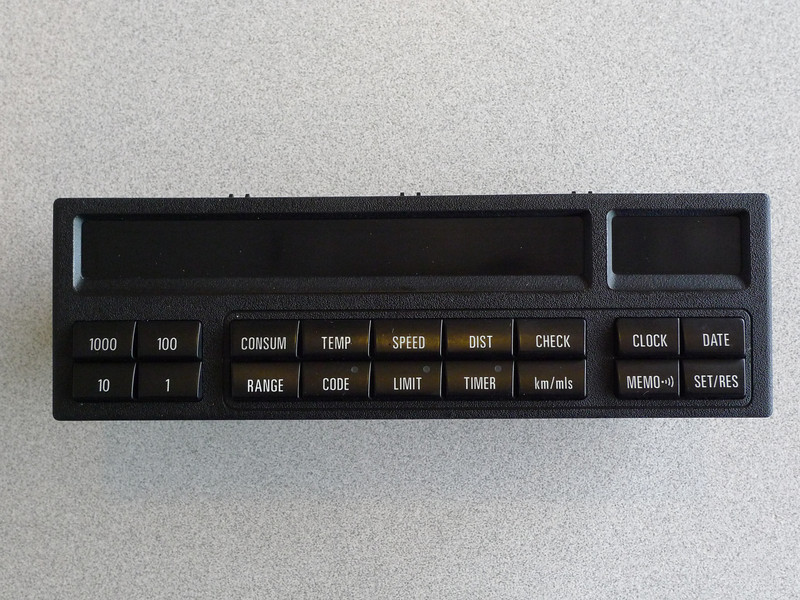
Now I had the basics of the application running on the Raspberry Pi, I needed some way of starting/stopping the logging, and knowing what its current status is. Originally I planned on just having a switch and a single LED, as the rPi has input/output pins available for use, which is ideal for things like that. I then thought why not make use of the 18 button OBC already in the car, and have those buttons control the logging. My OBC did not work properly anyway, so I pulled it apart and started tracing the circuit board inside.

The 18 button OBC has three LEDs as standard, on the Code, Limit and Timer keys. Now the keypad circuit only has 15pins on its connector, but there are 18 buttons, 3 LEDs, and power/earth for the illumination. After some trial and error, it turns out four pins are for the LEDs (12v and three LEDs) and only nine are for the actual keys. The keypad is actually a 5x4 matrix, very similar to a door entry keypad. In software terms you read rows and columns to determine what button has been pressed. Here is how the keypad is laid out:
So for example, if
Timer is pressed, pin 10 and pin 13 are linked. This is then detected in the software, and you can look the value up in a table to determine what button that is. Even though I'm only going to use a handful of the buttons, I wired them all up to the rPi anyway. This is also based on threading, so the application is 'waiting' for a button press in the background, and does not have to constantly look for one being pressed, which would mean the application hangs. The LEDs were also connected to the rPi, so each could be illuminated in software when different conditions were met.
I hacked up a bit of the OBC, and added a rocker switch to the far left, which controls the power going to the rPi. I then set up
Temp, Speed and
Dist as the control buttons for the application.
Temp starts the logging,
Speed stops the logging, and
Dist adds a marker into the logfile at the moment it is pressed, incase I ever need to look up a certain part of the logfile. On the far right, I used the
Clock button which shuts down the rPi properly. With the rPi using an SD card for its operating system, you don't really want to be just turning the power off (essentially pulling the power lead from your computer), as its quite common for the SD card to corrupt.
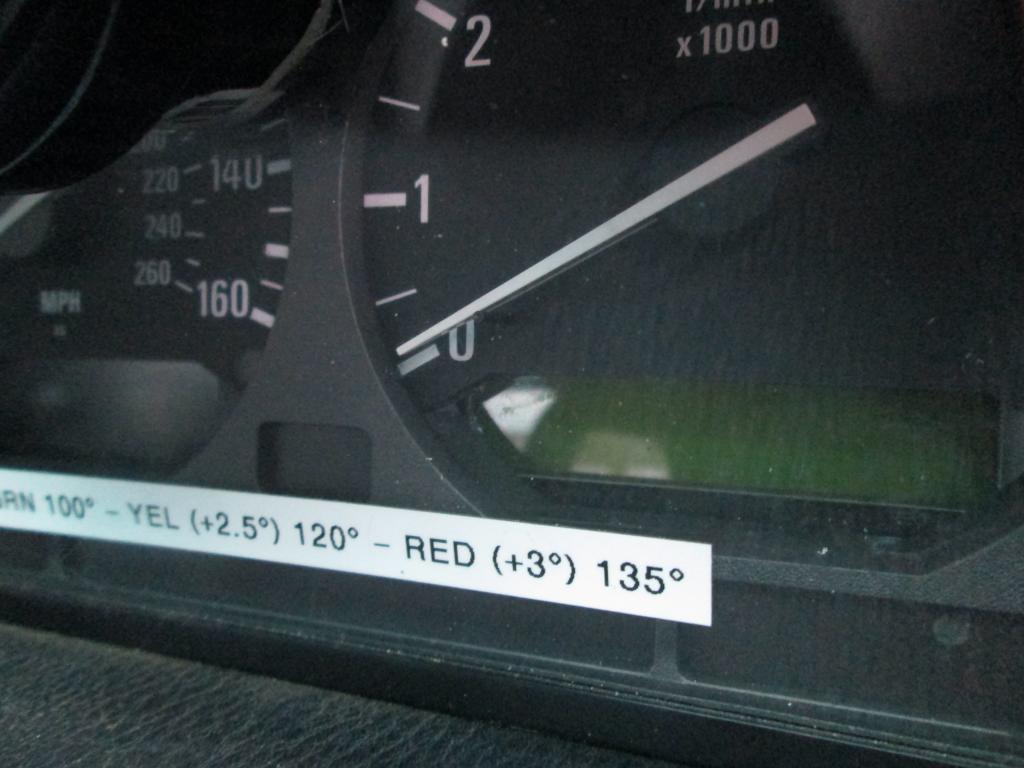
The last thing I wanted to do was try and make a small 16x2 LCD screen fit inside the instrument cluster, where the MPG readout usually is. This can also be controlled by the rPi, and display whatever you like on the screen. I thought it would be a good idea to show the current logging status, the length of the current log and is the application is reading the ECU data correctly.
Technically you could display any of the ECU values on the LCD, but it wasn't priority yet. I picked up a £5 16x2 LCD, which uses the I2C protocol, meaning you only have to use two wires back to the rPi for it to function, instead of the usual 8. The rPi is I2C compliant as standard, which many other devices use when talking to each other. I managed to get it mounted in place, and continued with the application.

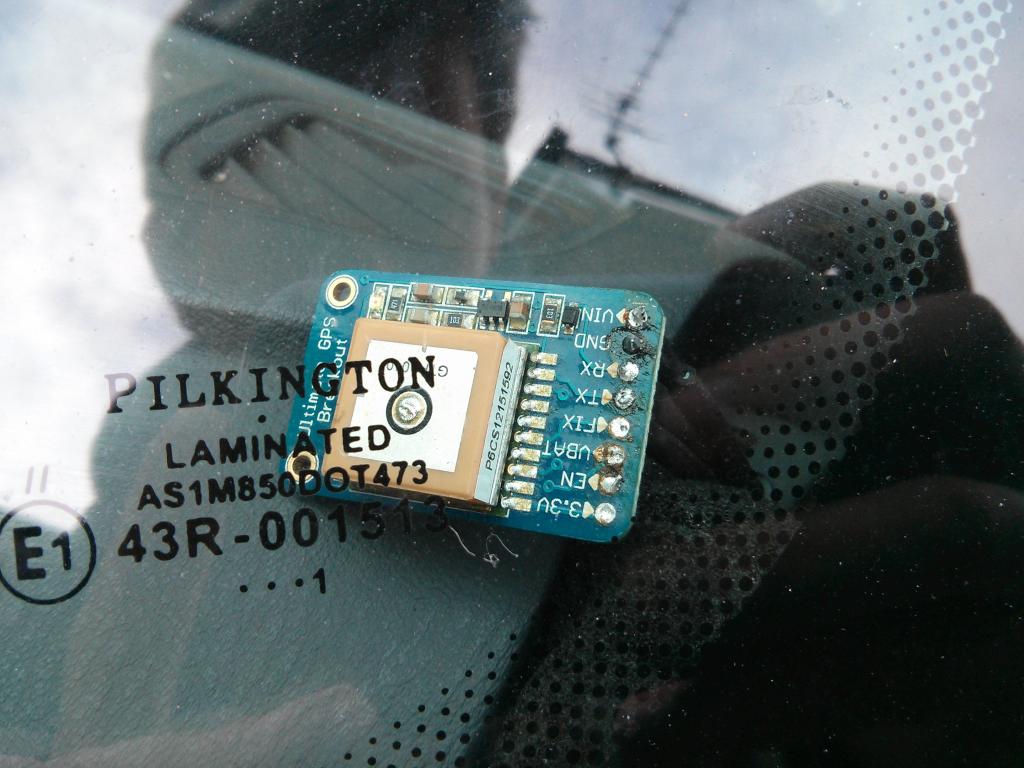
Once up to this point I was testing the application on the car, and remembered this data could actually be overlaid on videos from track days, making them a bit more interesting. In addition to the live engine data, I wanted to see if it was possible to add GPS data into the same log file, which would also give you a true speed reading, not just somewhere close like the ECU/Speedo do. I picked up a small GPS chip that runs on the same voltage as the rPi, and mounted it at the bottom of the windscreen inside the car. This particular model gets a fix within 30 seconds, and just outputs a serial stream of GPS data at 10hz constantly after getting a fix. The only part left was to incorporate another background thread in my application which would read the latest GPS data from the stream, and insert it into each row with the engine data.

So with all this built into the application, I ended up with about 800 lines of code, and realised some parts could work a bit more efficiently. I re-wrote some parts of it a couple of times with more testing, and got it down to around 500 lines. I then properly finished all the wiring in the car, and mounted the rPi in the glovebox out of the way. Really pleased with how it works, as below:
YouTube Link
The RaspberryPi takes about 20 seconds to boot up, which is automatic when you turn the power on. The Python application then automatically starts and outputs to the LCD. The
Code LED on the keypad illuminates once everything is ready, and the buttons are disabled up to this point. Once you start the logging, the
Limit LED flashes to indicate logging is currently in progress. When you stop the logging, the flashing stops. In addition to this, the LCD displays the current logging status, and the length of the current log.
The log files are saved on the SD card, which can then be used in an application back on the PC to plot the sensor data. An example of the 'finished' log file:
Code:
Time;Date Time;GPS Time;RPM;AFR;Intake Temperature;Coolant Temperature;Ignition Advance;Injector Duration;Camshaft Angle;Engine Load;Idle Control Valve;Battery Voltage;TPS Voltage;TPS Percent;GPS Latitude;GPS Longitude;GPS Altitude;GPS Speed (m/s);GPS Speed (mph);Log Marker
59.484896;01/01/70 01:00:59;2014-10-25T17:47:00.000Z;889;13.3;32.4100;72.4500;12.2080;2.7661;25.8405;103.7190;0.0153;13.7700;0.663;0;53.476971667;-2.574645;37.6;5.324;11.9092556;0
59.721561;01/01/70 01:00:59;2014-10-25T17:47:00.000Z;862;13.1;32.4100;72.4500;13.3270;2.7341;25.4660;108.5490;0.3519;13.8720;0.663;0;53.476971667;-2.574645;37.6;5.324;11.9092556;0
59.957776;01/01/70 01:00:59;2014-10-25T17:47:00.000Z;838;13.1;32.4100;72.4500;14.0730;2.7501;24.7170;110.0190;0.3519;13.9740;0.663;0;53.476971667;-2.574645;37.6;5.324;11.9092556;0
60.193968;01/01/70 01:01:00;2014-10-25T17:47:00.000Z;825;13.1;32.4100;72.4500;14.4460;2.7768;24.7170;111.7620;0.3519;13.8720;0.663;0;53.476971667;-2.574645;37.6;5.324;11.9092556;0
60.430485;01/01/70 01:01:00;2014-10-25T17:47:00.000Z;809;13.2;32.4100;72.4500;14.8190;2.8195;25.8405;113.9670;0.6885;13.9740;0.663;0;53.476971667;-2.574645;37.6;5.324;11.9092556;0
So with everything working, and a bit of fine tuning to the code, I managed to go and do some actual logging, needless to say it all works really well. Here a few plots, all on a private runway of course:
3rd > 4th Gear Pull - Speed, RPM, Throttle Position (%), AFR
3rd > 4th Gear Pull - Speed, RPM, Throttle Position (%), Engine Load (mg/Stroke)
2nd > 3rd Gear Pull - Speed, RPM, Throttle Position (%), AFR
2nd > 3rd Gear Pull - Speed, RPM, Injector Duration (ms), Ignition Advance (Degrees)
You can really see where the M54B30 inlet cam comes alive at 2700rpm or so, and the RPMs increase so much quicker than the M52B28 ever did. Plenty more sensor values that can be added and compared, will be good for fault finding along with everything else. Next step is to use the data over the top of a video, which will be easy enough back on a PC.
Hopefully all the above info will be useful to someone one day, any questions just ask, but I'm not going to do it for you! Just need to change the oil on the car now, give everything a once over and do some more testing of the logger before Oulton Park in a couple of weeks


